Which State Is Most Dependent On Guns?
Take a guess.
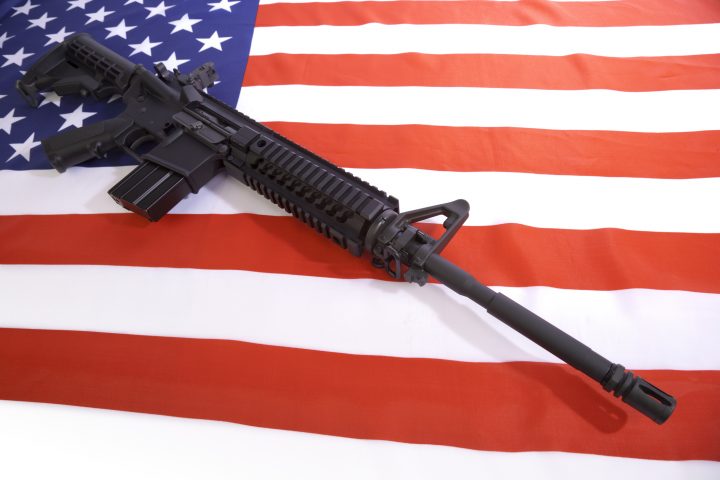
On March 15 WalletHub published the results of a survey aimed at determining which state was most dependent on the gun industry. Since we’ve been publishing reports of the gun industry being in a “Trump Slump” since the new president was elected, we know that a lot of state’s economies are being ruffled by the lack of gun sales over the past few months.
States with gun manufacturers are worried about their factories being permanently closed. Many states are affected. According to the WalletHub article, guns are estimated to contribute more than $51 billion to the United States economy. Guns generated $7.4 billion in federal and state taxes in 2016.
WalletHub “compared the economic impact of guns on each of the 50 states and the District of Columbia to determine which among them leans most heavily on the gun business both directly for jobs and political contributions and indirectly through ownership.”
The state with the Number One economy most influenced by guns was Alaska. Wyoming, Montana, South Dakota and Idaho rounded out the top 5 spots. Not terribly surprising that these top states are some of the most rugged and remote states in the nation. They are also the top 4 out of 5 states with the most firearms-industry jobs per capita. The other one that is not in the op 5 that has a lot of industry jobs is New Hampshire (which has a Sig Sauer factory). The last 5 states, meaning the ones that are least dependent on guns, were California, New Jersey, New York, Delaware and Rhode Island.
The survey came up with a lot of other interesting tidbits. Here’s some:
The Highest Average Wages and Benefits in the Firearms Industry
- District of Columbia
- Connecticut
- Massachusetts
- New York
- Rhode Island
State of Highest Gun Ownership
- Alaska
- Arkansas
- Idaho
- West Virginia
- Wyoming
Lowest Gun Ownership
- New Hampshire (Interesting! So all those people who work at Sig Sauer aren’t buying. NH also has strict laws.)
- New Jersey
- New York
- Rhode Island
- Delaware
Most NICS Background Checks Per Capita
- Indiana
- Kentucky
- Illinois
- Montana
- South Dakota
Least NICS Background Checks Per Capita
- Rhode Island
- New York
- New Jersey
- Hawaii
- District of Columbia
See all of the results of the survey here.

